- Essentials
- Getting Started
- Agent
- API
- APM Tracing
- Containers
- Dashboards
- Database Monitoring
- Datadog
- Datadog Site
- DevSecOps
- Incident Management
- Integrations
- Internal Developer Portal
- Logs
- Monitors
- Notebooks
- OpenTelemetry
- Profiler
- Search
- Session Replay
- Security
- Serverless for AWS Lambda
- Software Delivery
- Synthetic Monitoring and Testing
- Tags
- Workflow Automation
- Learning Center
- Support
- Glossary
- Standard Attributes
- Guides
- Agent
- Integrations
- Developers
- Authorization
- DogStatsD
- Custom Checks
- Integrations
- Build an Integration with Datadog
- Create an Agent-based Integration
- Create an API-based Integration
- Create a Log Pipeline
- Integration Assets Reference
- Build a Marketplace Offering
- Create an Integration Dashboard
- Create a Monitor Template
- Create a Cloud SIEM Detection Rule
- Install Agent Integration Developer Tool
- Service Checks
- IDE Plugins
- Community
- Guides
- OpenTelemetry
- Administrator's Guide
- API
- Partners
- Datadog Mobile App
- DDSQL Reference
- CoScreen
- CoTerm
- Remote Configuration
- Cloudcraft (Standalone)
- In The App
- Dashboards
- Notebooks
- DDSQL Editor
- Reference Tables
- Sheets
- Monitors and Alerting
- Service Level Objectives
- Metrics
- Watchdog
- Bits AI
- Internal Developer Portal
- Error Tracking
- Change Tracking
- Event Management
- Incident Response
- Actions & Remediations
- Infrastructure
- Cloudcraft
- Resource Catalog
- Universal Service Monitoring
- End User Device Monitoring
- Hosts
- Containers
- Processes
- Serverless
- Network Monitoring
- Storage Management
- Cloud Cost
- Application Performance
- APM
- Continuous Profiler
- Database Monitoring
- Agent Integration Overhead
- Setup Architectures
- Setting Up Postgres
- Setting Up MySQL
- Setting Up SQL Server
- Setting Up Oracle
- Setting Up Amazon DocumentDB
- Setting Up MongoDB
- Connecting DBM and Traces
- Data Collected
- Exploring Database Hosts
- Exploring Query Metrics
- Exploring Query Samples
- Exploring Database Schemas
- Exploring Recommendations
- Troubleshooting
- Guides
- Data Streams Monitoring
- Data Observability
- Digital Experience
- Real User Monitoring
- Synthetic Testing and Monitoring
- Continuous Testing
- Product Analytics
- Session Replay
- Software Delivery
- CI Visibility
- CD Visibility
- Deployment Gates
- Test Optimization
- Code Coverage
- PR Gates
- DORA Metrics
- Feature Flags
- Security
- Security Overview
- Cloud SIEM
- Code Security
- Cloud Security
- App and API Protection
- Workload Protection
- Sensitive Data Scanner
- AI Observability
- Log Management
- Administration
iOS Mobile App Launch Monitoring
Overview
Application launch monitoring helps you understand how fast your iOS app becomes usable after a user taps the app icon. Use it to identify slow startup times, track performance regressions, and optimize the user’s first impression of your app.
With this feature, you can:
- Measure time to initial display (TTID) and time to full display (TTFD) for cold and warm starts
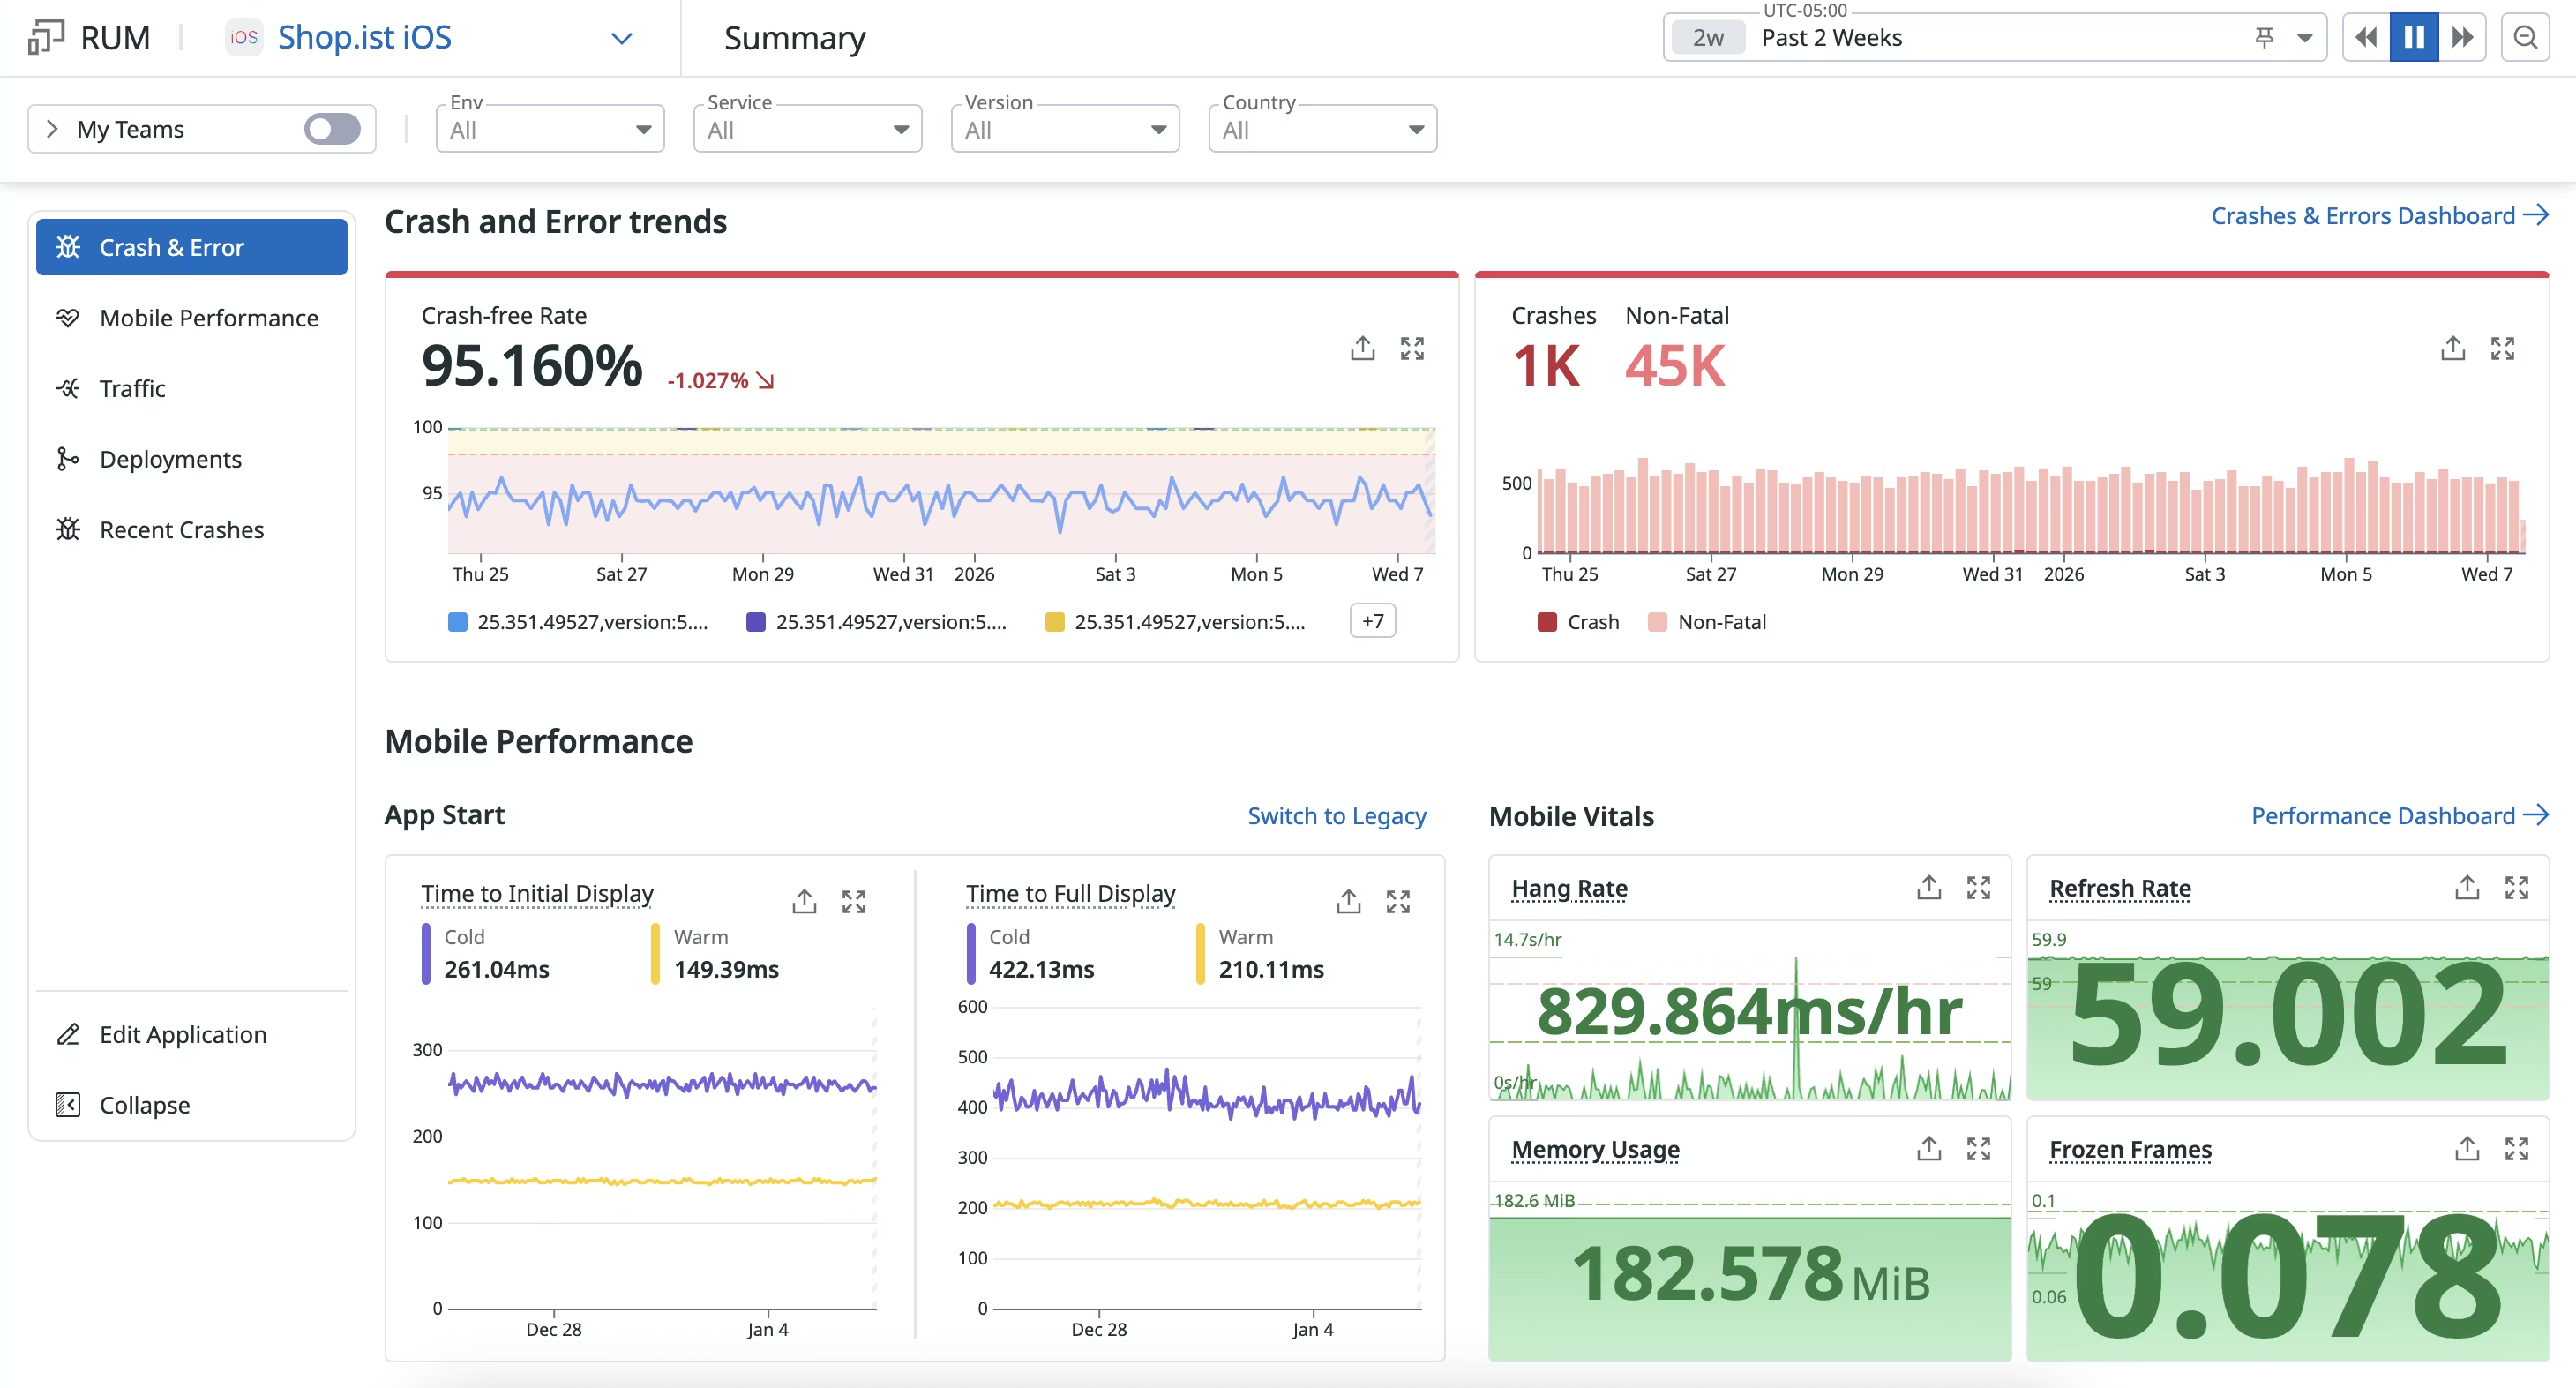
- View launch performance trends in the RUM Summary and Mobile Performance Dashboard
- Drill into individual launch events to diagnose bottlenecks
How it works
During initialization, the RUM iOS SDK creates a view called ApplicationLaunch. This view’s start time matches the start of the iOS process. The ApplicationLaunch view includes any logs, actions, and resources created before your first call to startView.
The
application_start action is not collected in iOS SDK versions 3.5.0+. The rum.measure.app.startup_time metric is marked as deprecated but continues to report data from devices running app versions that use older SDK versions.Time to initial display and time to full display
In iOS SDK versions 3.5.0+, the time to initial display (TTID) and time to full display (TTFD) are collected during the application launch period.
| Measurement | Summary | Details |
|---|---|---|
| Time to initial display | The time it takes to display the first frame of the app’s UI. | The time taken for an app to produce its first frame, including process initialization, scene and view hierarchy creation, and initial UI rendering. The splash screen, which the iOS manages, is not included in this calculation. |
| Time to full display | The time it takes for an app to become interactive for the user. | The time it takes to display the first frame of the app’s UI, as well as the content that loads asynchronously after the initial frame is displayed. |
Each time to initial display and time to full display is categorized by launch type:
- Cold start: Occurs when the system must fully initialize a new application process because no prior state or memory image can be reused. This includes launches after a first install, device reboot, application updates, or when the system has removed the application from memory.
- Warm start: Occurs when the application process is relaunched, but the system can reuse some resources that were cached in memory. Warm starts typically occur in scenarios such as a user manually force-quitting the application, iOS terminating the application in the background due to memory or resource pressure, or an application crash.
Either cold or warm starts can be prewarmed, which is an iOS-specific optimization starting from iOS 15. In this scenario, the system proactively prepares the app process in the background to improve future launch times. Pre-warming typically occurs when:
- The device has recently rebooted.
- The system predicts that the user is likely to open the application soon.
- The OS is executing background optimization routines.
Measuring the time to initial display
The iOS SDK automatically measures the time to initial display. The time to initial display can be optionally profiled using the iOS Mobile Profiler.
Measuring the time to full display
Every application behaves differently, so the iOS SDK does not automatically detect when to measure time to full display. As a result, the SDK needs to be notified when the application reaches the fully drawn state.
The time to full display is manually defined using the Monitor.reportAppFullyDisplayed() API in the iOS SDK based on the application’s specific definition of “fully drawn.”
The example below calls Monitor.reportAppFullyDisplayed() to measure the time to full display after the app finishes loading the data needed to render its initial UI. The signal is sent only once the UI has been updated with the received content or the error has been properly handled.
@MainActor
class HomeViewController: UIViewController {
    override func viewDidLoad() {
        super.viewDidLoad()
        Task { await loadData() }
    }

    private func loadData() async {
        let url = URL(string: "https://api.example.com/data")!
        do {
            let (data, _) = try await URLSession.shared.data(from: url)
            updateUI(with: data)
        } catch {
            // Handle the error if needed
        }

        // Mark the app as fully displayed
        RUMMonitor.shared().reportAppFullyDisplayed()
    }
}
If the time to full display is not defined, the iOS SDK only collects the time to initial display.
RUM summary
The time to initial display and time to full display are presented in the RUM Summary under Mobile Performance. The standalone Mobile Performance Dashboard also contains distribution visuals for time to initial display and time to full display.
Vital events
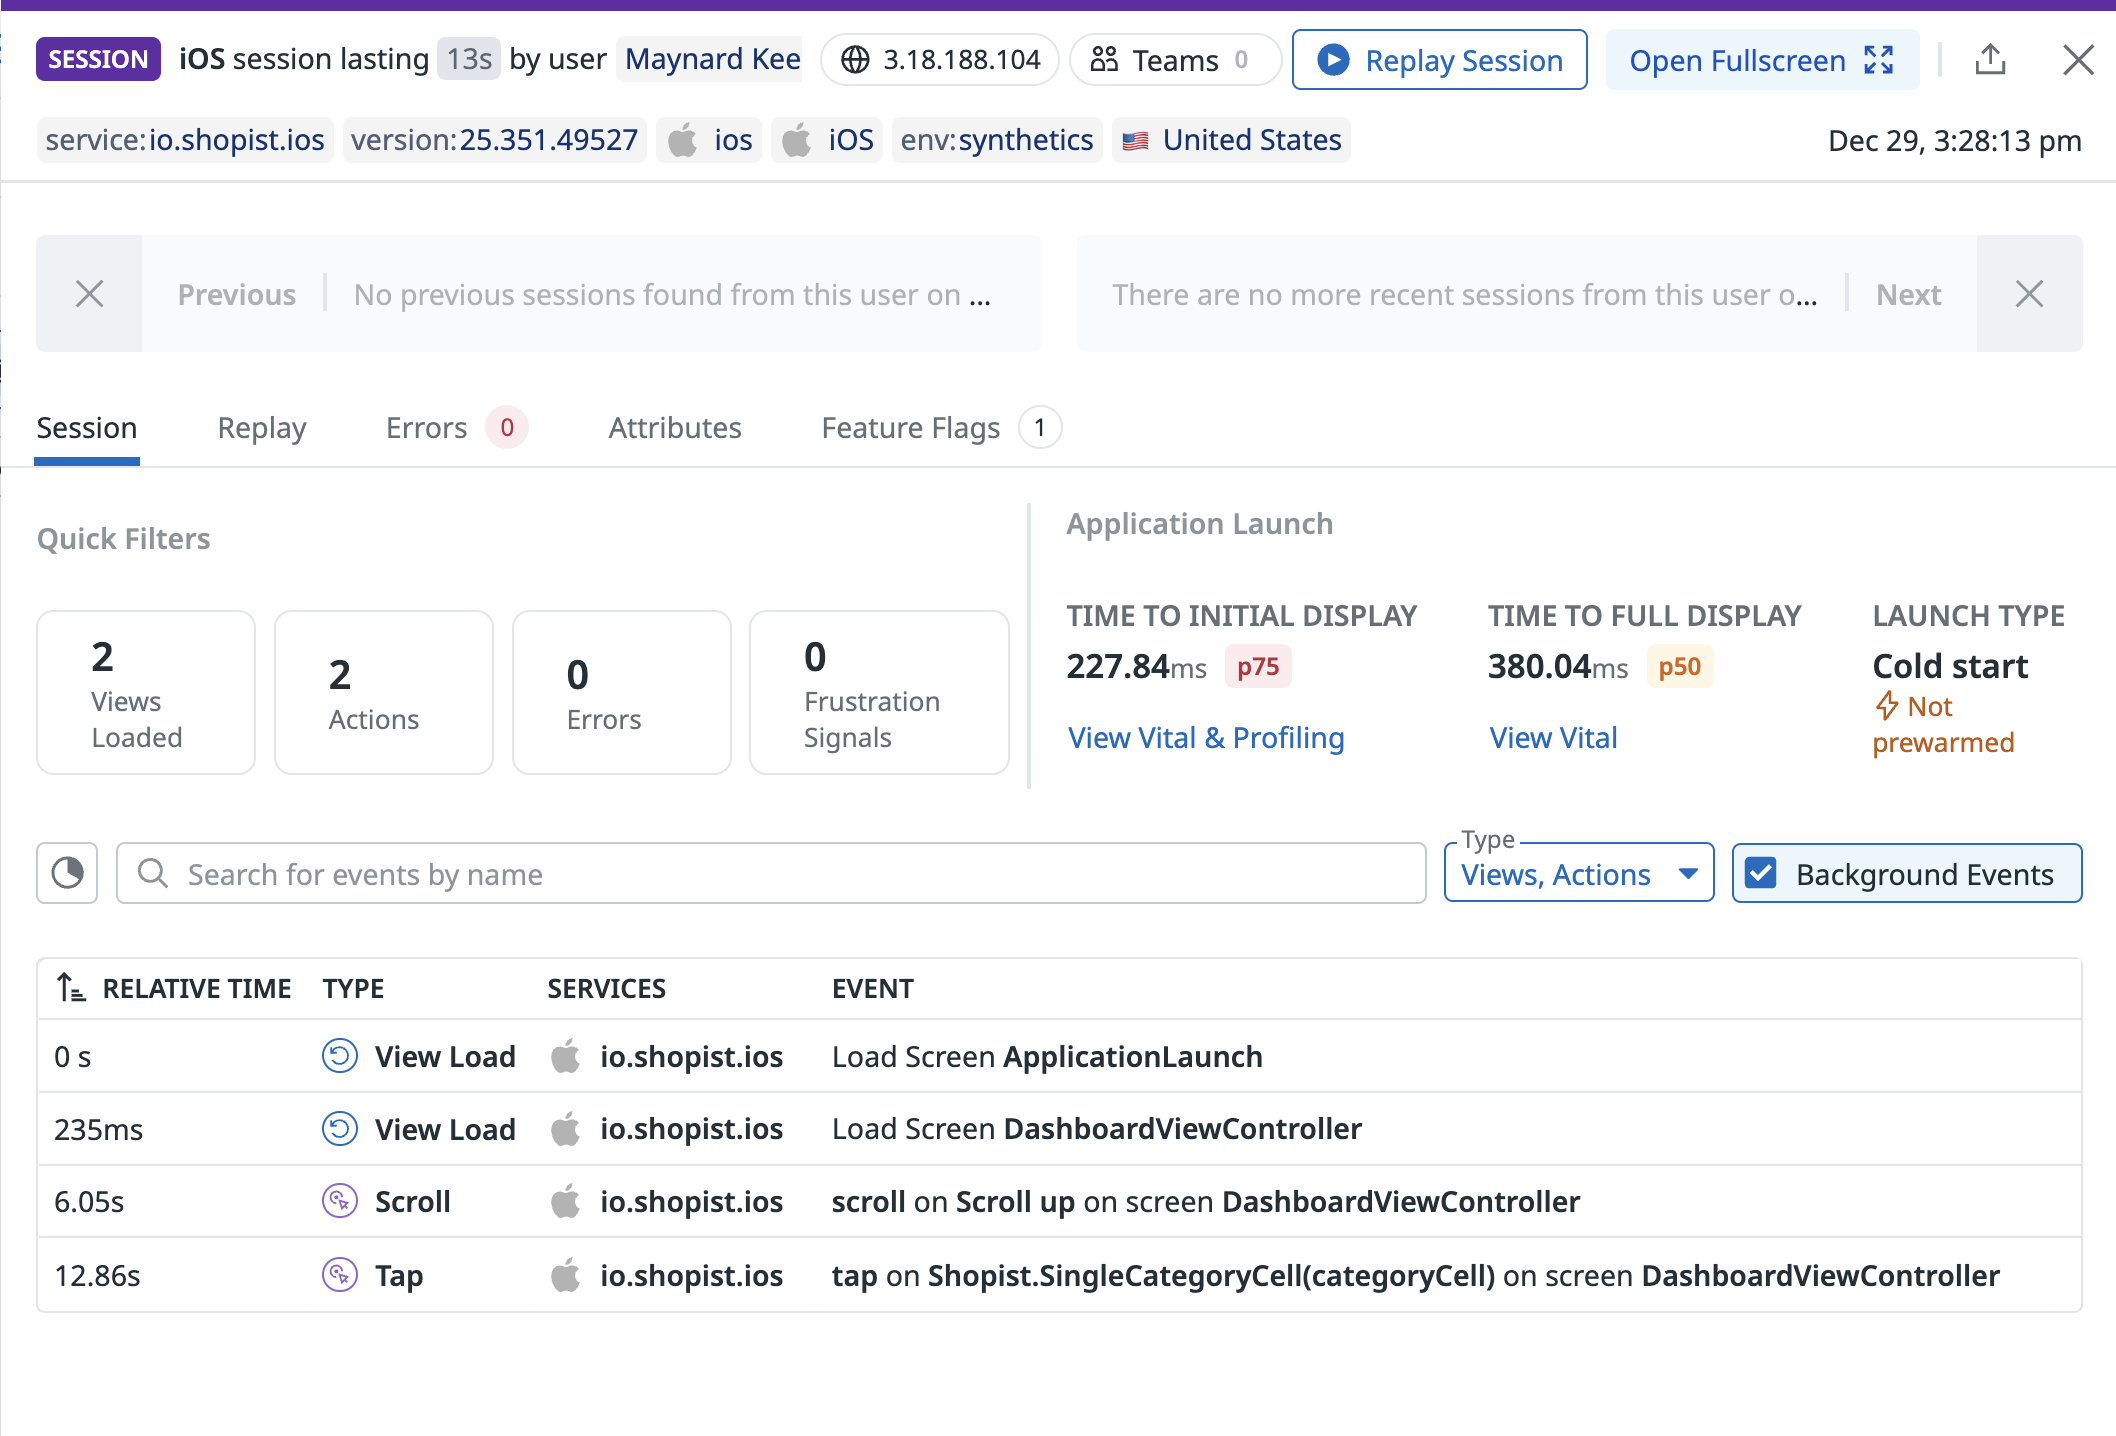
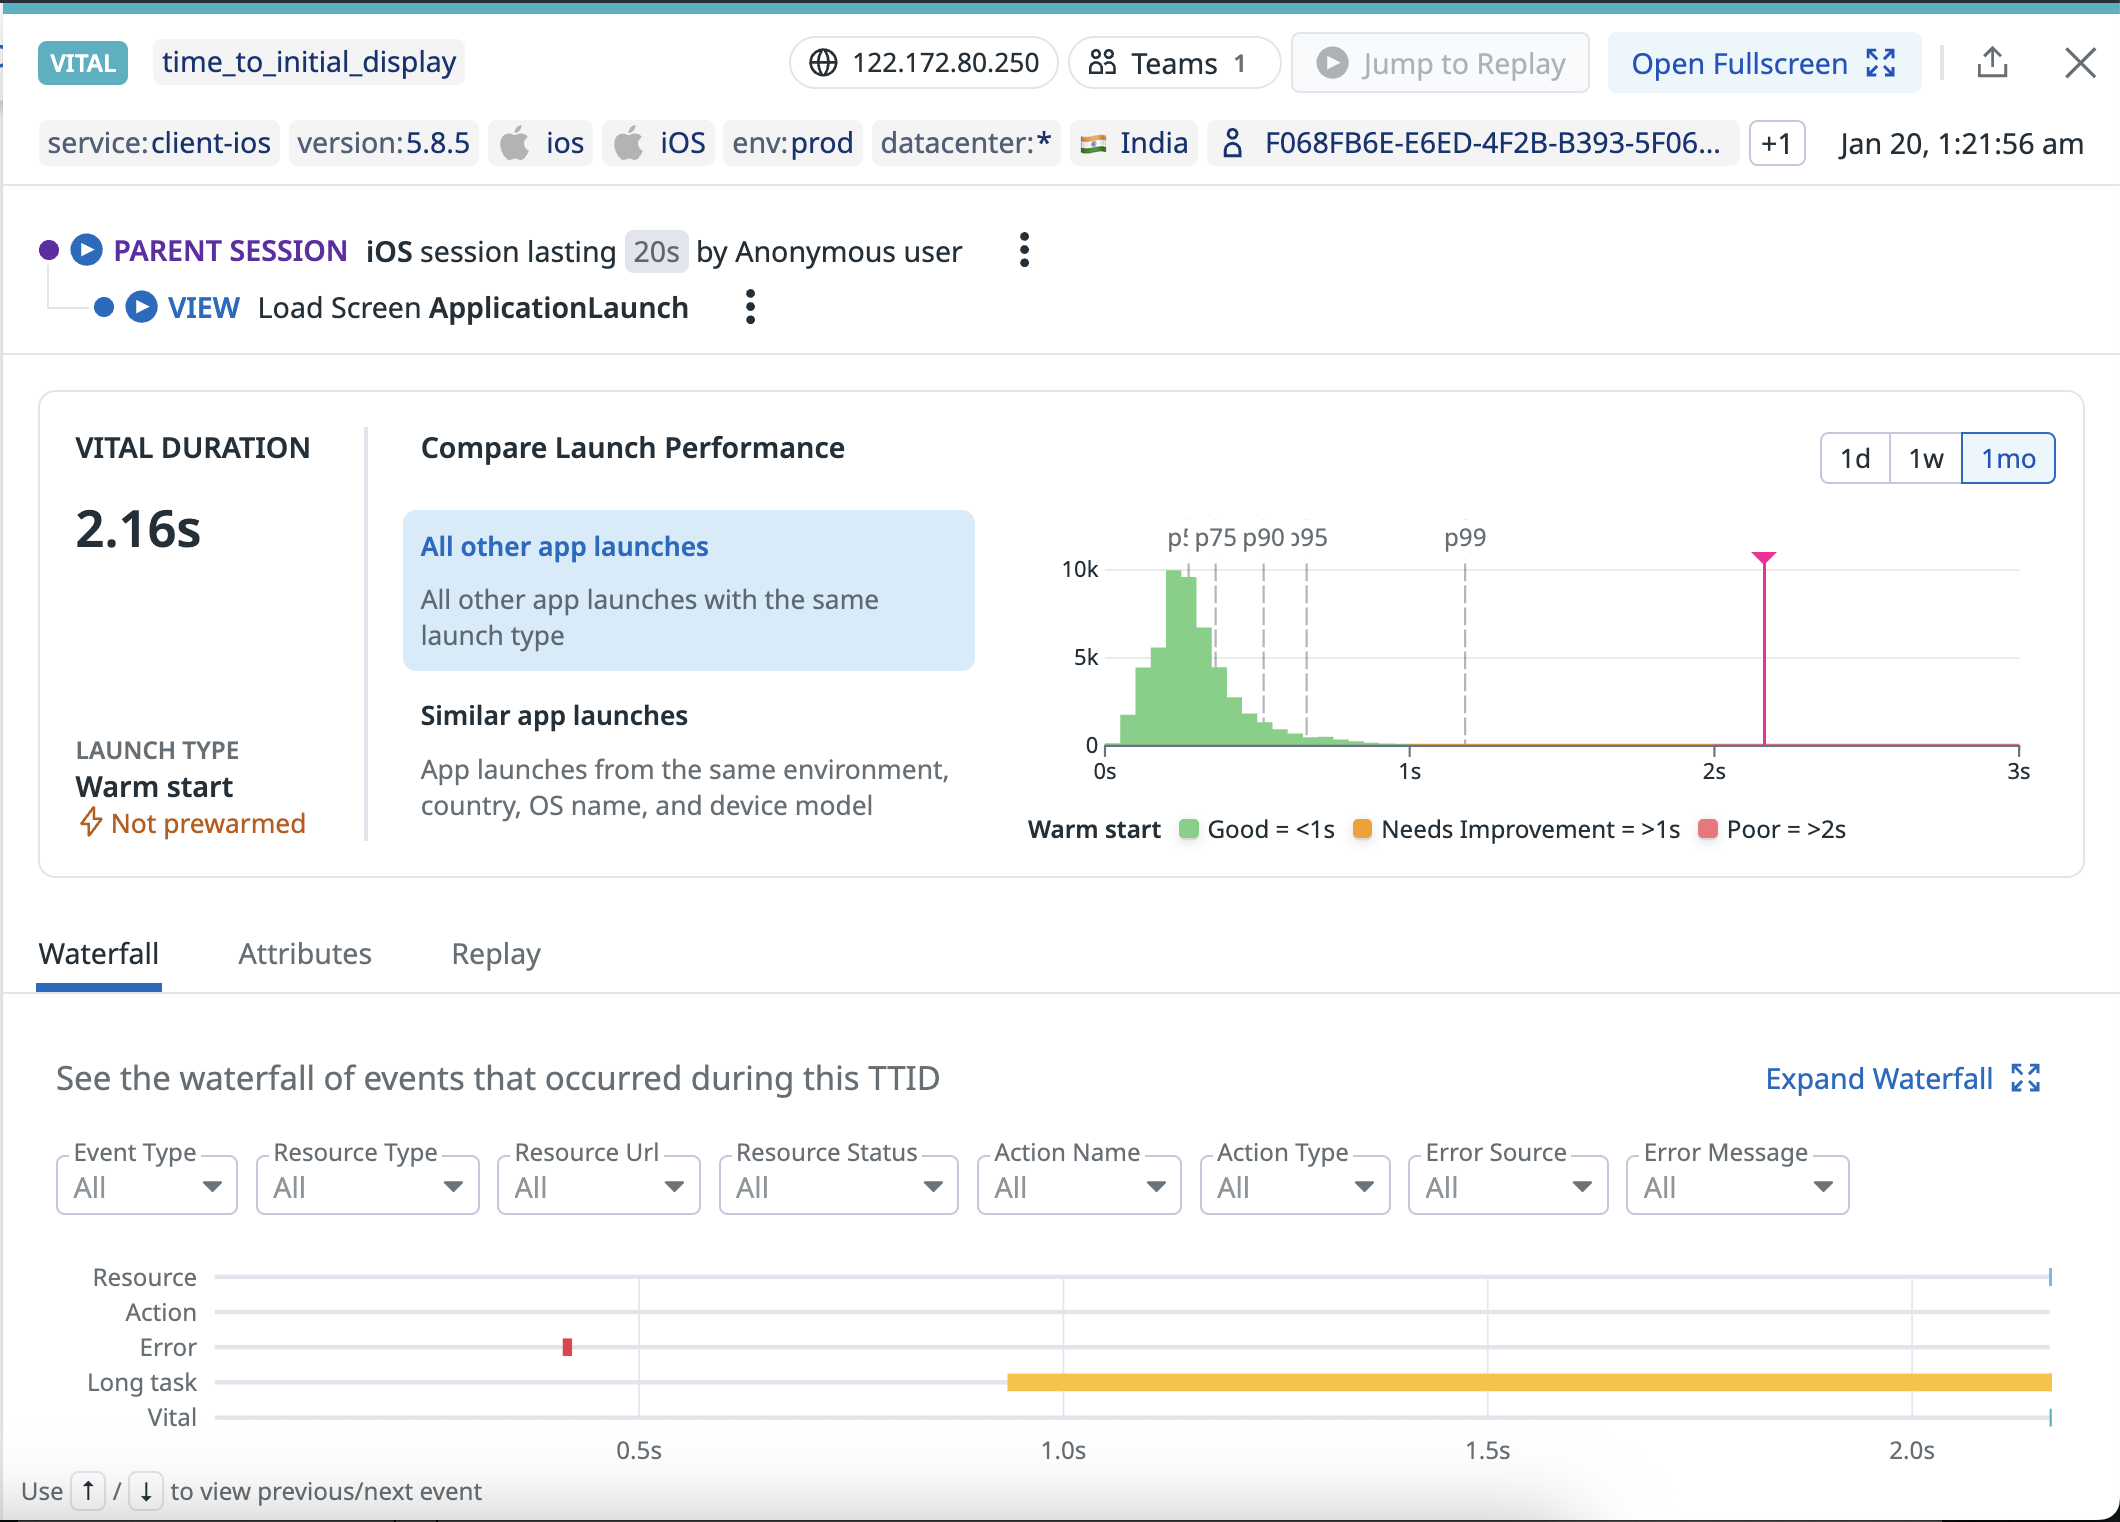
The time to initial display and time to full display are presented as vital events in the RUM session. They are also found under the first view after the ApplicationLaunch view. TTID and TTFD are captured if the user launches the application in the session. Neither TTID nor TTFD appear if the user does not launch the application during the session.
The TTID and TTFD can be queried in the RUM Sessions Explorer using the following attributes on the vital event type:
@vital.type:app_launch@vital.name:time_to_initial_displayor@vital.name:time_to_full_display
Each TTID and TTFD side panel contains a distribution visualization, an indication of whether the launch was cold or warm, and an event waterfall.
Metrics
The time to initial display and time to full display are calculated as metrics:
rum.measure.app.startup_to_initial_display, which represents the time to initial displayrum.measure.app.startup_to_full_display, which represents the time to full display
These metrics contain attributes to specify the launch type for accurate monitoring:
@vital.startup_type@vital.is_prewarmed
The
rum.measure.app.startup_to_full_display metric are not calculated if the time to full display is undefined.Further reading
Additional helpful documentation, links, and articles:


